Visualizing 10 years of impact
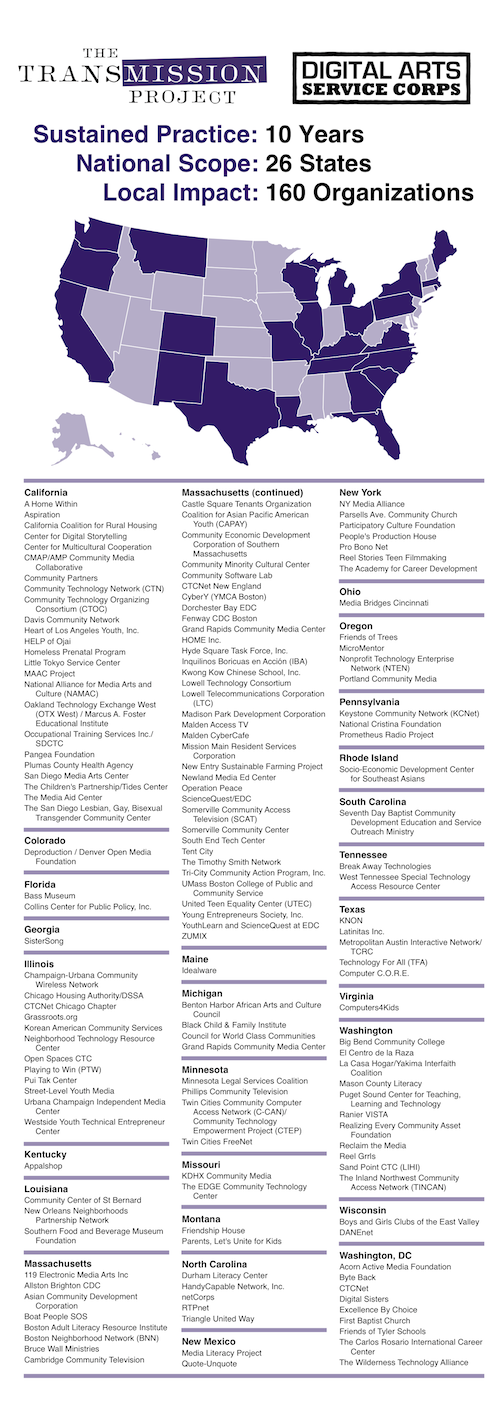
Yesterday we posted an infographic showing all of the service members we’ve placed. Since our focus is on building the capacity of organizations that use media and technology to strengthen communities, it’s equally important (if not more) to chart out all of the nonprofits and institutions we’ve placed Digital Arts Service Corps (and CTC VISTA before it) members over our 10 year history. (160 organizations is a tough fit, so you can download this visual as a full-sized PDF for easier reading.)
| Attachment | Size |
|---|---|
| Transmission Project - Size and Scope Infographic.pdf | 254.38 KB |
Comments
Post new comment