visual
Telling compelling stories with Data
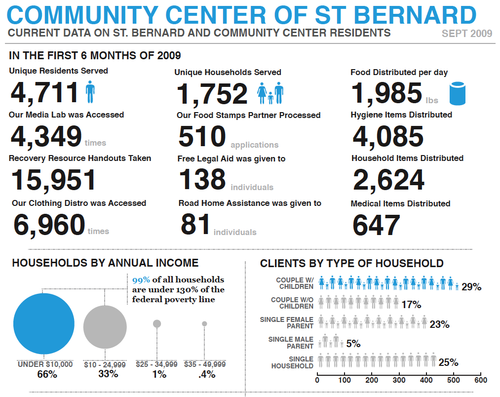
I am blown away by the data visualizations created by VISTA Billy Brown serving at the Community Center of St. Bernard. The image above is part of a data report that his supervisor found so compelling she took it to a funder.
Visualizing Usage Data
![[node-title]](../../sites/transmissionproject.org/files/imagecache/resource-thumbnail/resources/thumbs/Screen shot 2009-10-20 at 3.06.17 PM.png)
Organization:
Community Center of St. Bernard This great visualization of access and usage was created by VISTA member Billy Brown for the Community Center of St. Bernard.
Visualising Social Media Reporting
![[node-title]](../../sites/transmissionproject.org/files/imagecache/resource-thumbnail/resources/thumbs/Screen shot 2009-10-20 at 2.52.04 PM.png)
Organization:
Community Center of St. Bernard This Social Media Report shows the results of a survey given to members visiting the Community Center of Saint Bernard. It is useful in providing this information in a meaningful and engaging format.